
Historically, maintenance, repair, and operations (MRO) inventory management has been viewed as a necessary cost of doing business, a cost center, with little thought given into how much money is spent on acquiring and storing spare parts and materials. As a result, money has been tied up in overstuffed MRO stockrooms, emergency inventory purchases, and expedited shipping costs.
Today, organizations recognize maintenance operations as a potential source of cost savings. Upper management pays close attention to whether investments in MRO inventory result in improved asset availability and profitability. Due to the high costs and risks associated with poorly managed MRO inventory, upper management holds maintenance managers responsible for tracking inventory management metrics and KPIs.
| This article is part of a maintenance management metrics KPIs series. Read our other KPI articles: |
What are Inventory Management KPIs?
A key performance indicator (KPI) is a metric, or measured value, which is directly tied to a specific strategic business goal. Inventory management KPIs track how well your organization’s MRO inventory supports your organization’s goals and the return gained on investments in inventory. Over time, KPIs show you whether you are approaching or moving further away from your organization’s goals.
Before we dive into our discussion about inventory management metrics, we must point out the importance of working with reliable data. Whether you already have an inventory management system in place or are just beginning to track MRO inventory data, reliable data is essential.
Many organizations track inventory management activities with computerized maintenance management system (CMMS) software. A CMMS provides accurate data for calculating inventory management KPIs and removes the manual effort of generating maintenance reports.
Inventory Management KPI Examples
Every organization has unique business goals and therefore, uses their own set of inventory KPIs. Nonetheless, some common KPIs serve the needs of organizations in a range of industries. The purpose of this article is to introduce you to these common inventory metrics that can help you meet your maintenance management and MRO inventory management goals. Consider the following common inventory management KPIs.
For you convenience, the KPIs discussed in this article are also available as an infographic. Download the MRO Inventory Management KPIs infographic.
Inventory Accuracy: What’s In Stock?
One of the basic components of MRO inventory management is identifying what items you have and how many. The inventory accuracy KPI is simply a measure of how closely your count of physical inventory matches what is recorded in your CMMS or inventory management system.
To calculate this metric, an employee audits the items on your storeroom shelves and compares them to the database record. A truly accurate inventory will have matching on-hand quantities, storage location(s), and identification tags such as barcodes. Use the following formula to calculate the inventory accuracy KPI:

How to Interpret Inventory Accuracy
It is not realistic, nor practical, that records exactly match for every item that is counted. For example, data entry errors, mislabeled or confusing location codes, and outstanding transactions all impact inventory accuracy. For most organizations, inventory accuracy ratings of 95% or greater are considered acceptable. Sophisticated organizations may adjust this tolerance based on an item’s criticality, but for most, maximum accuracy is the goal.
If your inventory accuracy rating is low, it is imperative that you find out why and, if necessary, implement process improvements. Inaccurate inventory counts can lead to lost production, unnecessary downtime, under- or over-ordering, and costly emergency purchases.
Accuracy may be improved by performing regular physical inventory audits whether by exhaustive or cycle counting. CMMS software is a valuable tool which automatically updates inventory records as parts are updated in the system, via consumption on work orders or as newly purchased parts are received.
Inventory Turnover: How Much Stock Should I Have?
Whereas the inventory accuracy KPI tells you what is in stock, the inventory turnover KPI helps you determine how much inventory you should maintain. Ideally, there will be enough stock to meet demand but not so much that you have significant overstock.
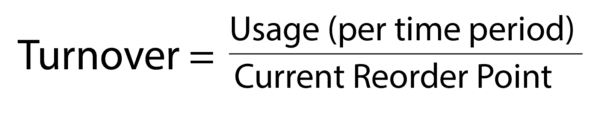
Turnover is the rate at which an inventory item’s stock is used. This KPI measures how quickly you work through the lowest level of stock of an inventory item you desire to keep on hand in a given time period. Knowing an inventory item’s turnover rate is used to help set an appropriate reorder point. Reorder point is the minimum quantity of an item that, when reached, triggers an action to replenish stock. Inventory turnover is determined by the following formula:
How to Interpret Inventory Turnover
Low turnover (values less than 1) is typically associated with infrequent usage and/or overstock. For example, a widget has a reorder point of 10 and 3 were used in a measured timeframe of one year. The widget’s turnover rate is 0.3 (3 ÷ 10 = 0.3). Being less than 1, a turnover of 0.3 means the item is used at a relatively slow pace. Keeping 10 widgets in stock at any given time when only 3 are used per year seems excessive. In this scenario, the reorder point could be lowered.
High turnover (values greater than 1) is typical of frequently-used items, which are more at risk of stockouts. For example, a widget’s reorder point is set to 10, and 30 were used in the measured timeframe. The turnover rate for the widget is 3 (30 ÷ 10 = 3). With a value greater than 1 (3 times greater than 1 in this case), the item is used at a relatively fast pace. The reorder point should be set carefully enough so that stock doesn’t run out.
Be aware that the inventory turnover KPI does not account for the type of inventory being managed, so values derived from this calculation require further investigation. Consider the case of critical spares. Critical spares naturally have low turnover because they are seldom used, but are held as safety stock. While regular usage is low, it is desirable to keep extra stock on hand as insurance. On the other hand, the turnover rate of often-used consumables and non-critical spares will be naturally high.
Another point that bears discussion is the timeframe in which turnover is calculated. Keep in mind that there is a delay between when orders are placed and when parts arrive. The time period used to determine turnover should be in line with your procurement process and cover the time from the start of the ordering process to the receipt of goods. We recommend the turnover reporting timeframe be no shorter than a week and no longer than a month.
Manually determining the optimal reorder point on tens, hundreds, or thousands of inventory items is nearly impossible. Simply reordering parts when they run out is not a sustainable strategy either. CMMS software contains features such as reorder point notifications, alerting you when parts need to be reordered. Integrated purchasing functionality allows you to automatically generate requisitions and purchase orders.
Stockouts: Are Parts Available When Needed?
The inventory stockouts KPI determines the frequency of out-of-stock occurrences, where stock is not available when needed. A stockout happens every time an employee attempts to retrieve a part and is unable to do so. Determining stockouts is fairly straightforward:

How to Interpret Stockouts
It goes without saying that stockouts should be avoided. In many industries, best practices suggest the value of the inventory stockouts KPI should be less than 1%. However, getting too carried away with eliminating stockouts can lead to overordering, which may result in overstuffed stockrooms and dead money that can’t be recovered.
Risk of stockouts influences reorder points and is typically looked at alongside the inventory turnover KPI. Low stockouts on items with low turnover can be a sign of overstocking. Low stockouts on high-volume items means that demand for the item is being met. Frequent stockout occurrences imply that reorder points may be set too low, though the length of your procurement process could also play a role. CMMS software keeps track of reorder points to help you avoid stockout occurrences.
Supply On Hand: How Long Will Stock Last?
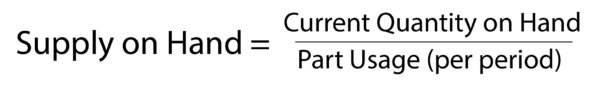
The supply on hand KPI estimates how long your current stock will last based on past usage. It takes into account your past usage and current quantity on hand, and expresses your supply in units of time. Supply on hand is determined by the following formula:
Calculating this metric is a little more involved than it first appears. Let’s walk through an example step by step:
- Find your usage for the most recent reporting time period. It’s important to select a time period large enough to give you an accurate representation of your usage. Using too short of time period, such as a week or month, may not represent your “typical” usage. In this example, let’s assume 25 widgets were used during a reporting period of one year.
- Divide your current quantity on hand by the usage during the time period. This gives you the usage for the time period. In this example, supply on hand will be expressed in terms of years since the reporting period is 1 year. We’ll use a quantity of 6 for our current quantity on hand.

- Convert the time period from the previous step into your desired time period. We’ll choose to express supply on hand in terms of weeks, so we will multiply our supply on hand in years by 52, as there are 52 weeks in a year. Note that the conversion factor used depends on the original reporting time period.
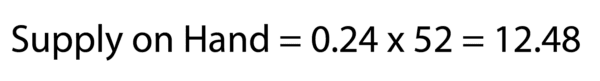 In this example, there is approximately 12 weeks’ supply of widgets.
How to Interpret Supply on Hand
Supply on hand reveals how long it would take for the quantity of the item to run down to zero. Of course, it would be wise to reorder before that point is reached. To gather meaning out of this metric, it should be looked at in tandem with other inventory metrics, like turnover and stockouts.
Low supply on hand may mean you have low stock or the reorder point is set too low. For low turnover items with a relatively short reporting timeframe, it may be that the item was recently replaced. Low stock items may be in danger of stockouts. Compare supply on hand with turnover and stockouts to determine whether the item has an appropriate reorder point.
Using the supply on hand calculation for high stock items identifies slow-moving or obsolete inventory. For slow-moving inventory, use the inventory turnover metric to determine a lower reorder point. Obsolete inventory can be set aside for future disposal, thereby clearing space for active inventory items.
Inventory reports available in CMMS software help you monitor your supply on hand and optimize inventory by bringing attention to slow-moving items.
Track Inventory Performance with FTMaintenance
Organizations are paying closer attention to how their investment in inventory is being managed. The inventory metrics provided in this article are intended to help you make smart decisions about your MRO inventory. CMMS software is a necessary tool for maintenance teams looking to track and improve their inventory practices.
FTMaintenance inventory management software provides a centralized system for tracking and managing your spare parts inventory. Quickly identify what’s in stock, automatically update stock levels, and create purchase requisitions in one click. Powerful reporting capability provides you with meaningful, actionable insights into inventory performance. Schedule a demo of FTMaintenance today.