![]()
Key Takeaways
- Tracking productivity helps keep employees accountable for their performance
- There are many common key performance indicators (KPIs) that can be used to track maintenance labor performance
- Understand how to interpret KPI results and how they might align with business goals
Labor performance tracking keeps employees accountable for completing assigned maintenance work in an efficient way. Organizations must have methods to measure the productivity and efficiency of their staff. This article discusses several labor performance metrics that you can use to track your maintenance team’s performance.
| This article is part of a maintenance management metrics KPIs series. Read our other KPI articles: |
Maintenance Employee Performance KPI Examples
Every maintenance team is comprised of a unique set of individuals, with varying levels of experience and skill. The employee performance metrics you track depends on the business goals of your organization.
The following productivity metrics represent common key performance indicators (KPIs) tracked by maintenance departments. Note that many of these KPIs rely on the availability of accurate time tracking data, such as that stored in a computerized maintenance management system (CMMS).
Average Service Request Response Time

Average Service Request Response Time is the average amount of time it takes to respond to work requested via a service request. This metric measures how quickly the maintenance team responds to service requests, starting when the request is submitted up until work towards solving the issue begins.
To calculate the average service request response time, take the sum of the response time—the total elapsed time between service request submission times and their related work order start times and divide it by the number of service requests submitted in the reporting timeframe.
Keep in mind what unit of time is used for the response time. Converting the output of this calculation from hours to minutes or minutes to hours requires an additional step. Convert values in hours to minutes by multiplying by 60; divide values in minutes by 60 to express in hours.
How to Interpret Average Service Request Response Time
A low (short) response time means the maintenance team responds to requests quickly. However, shorter response times should be viewed in context of the types of repairs requested. Employees are more likely to contact maintenance personnel directly for urgent issues, rather than submitting service requests.
A high (long) service request response time can mean there is a backlog of requests that are getting pushed to the backburner. However, a backlog may not be unusual because requests have to be balanced with other important maintenance work. Long response times may also indicate that requests are submitted with incomplete information. Work request management software, like a CMMS, standardizes the information required to submit requests.
Note that multiple factors come into play when analyzing average service request response time. Some organizations immediately turn all service requests into work orders. Others assign personnel to review incoming requests and prioritize them accordingly. At times, more information must be gathered before work can begin.
These factors greatly impact how quickly the maintenance team responds, thereby affecting the average response time. When analyzing response time, you may wish to select a subset of service requests that are similar in priority or complexity.
Average Task Completion Time

Average Task Completion Time measures the average amount of time it takes to complete a maintenance task. It estimates how long it takes to complete a specific maintenance and is used by maintenance managers to improve resource planning and maintenance scheduling.
To calculate the average task completion time, divide the total time required to complete the task by the number of times the task was performed during the reporting timeframe.
How to Interpret Average Task Completion Time
The average task completion time primarily applies to planned maintenance activities, where a baseline completion time is known. Owner’s manuals typically include these time estimates. Therefore, a good starting point is to compare your measured task completion time to the values provided by the asset’s manufacturer.
High or rising average task completion times mean tasks take longer to complete than expected. A logical next step is to compare task completion times between employees to determine whether the issue lies with a particular person or team. It could be possible that task instructions are not clear and misunderstood, or that additional training is needed.
Average task completion times that are close to the benchmark value provided in maintenance documentation are ideal. It means technicians are skilled and informed enough to complete maintenance work in a timely manner. Still, expect some variance in completion time, within reason.
Low or falling task completion times mean that tasks are completed quickly. Though preventive maintenance work tends to be less complex and, therefore takes less time, it is normal to scrutinize suspiciously low values. It may be an indication that technicians are rushing through work, skipping steps, cutting corners, or underreporting their work time in an attempt to look more productive.
Work Order Activity

Work Order Activity tracks how many work orders are completed compared to past performance. This metric helps determines the maintenance team’s productivity.
To calculate work order activity, divide the number of work orders completed within a given time period by the number of completed work orders within an equal previous time period, and then multiply by 100 to express the value as a percentage.
How to Interpret Work Order Activity
The Work Order Activity metric compares performance between two time periods:
- If the result that is greater than 100%, more work orders were completed in the most recent period.
- If the result is or is close to 100%, performance was consistent between the two reporting periods.
- If the result is less than 100%, fewer work orders were completed compared to the previous period.
Tracking this KPI over time allows you to analyze trends. Consistently increase values indicate higher, more efficient performance, while consistently decreasing values indicate that performance may be declining. However, employees are not always at fault for decreasing values.
The Work Order Activity metric does not account expose the reasons why productivity increased or decreased, however. For example, imagine that in the previous reporting period the maintenance team completed a large number of low priority inspections, part replacements, and work requests. This period, a high priority, relatively complex annual preventive maintenance job was completed over multiple days. In this scenario, work order performance may appear low, even though the annual work order held greater importance to the organizations.
Other possible causes of decreasing performance include:
- Understaffed maintenance teams
- Stockout occurrences that delay maintenance work
- Lack of equipment availability to maintenance
- The need to complete unexpected or higher priority maintenance work
The reporting period may also be to blame. The shorter the reporting timeframe, the more variability there will be in the result. For instance, comparing values week-to-week will show greater fluctuations than when comparing month-to-month, quarter-to-quarter, or year-to-year. Longer time frames account for more natural variance in maintenance needs, and give a more accurate picture of work order activity.
Wrench Time

Wrench Time measures the percentage of time a maintenance technician spends manually performing maintenance work. It does not include time spent traveling to the asset, retrieving inventory parts from the stock room, reviewing maintenance history, and other tasks that don’t involve physically repairing an asset.
To calculate wrench time, divide wrench hours by total working hours, then multiply by 100 to find the value as a percentage.
| Be aware that tracking true wrench hours requires granular, consistent, and accurate time tracking. We also recognize that there are many methods of measuring wrench hours, each with varying amounts of accuracy. Therefore, wrench time remains a controversial metric in the maintenance industry. The decision whether to use wrench time as a KPI is up to your organization. |
How to Interpret Wrench Time
Wrench time can be tricky to interpret, even deceiving. Remember that the time physically performing work represents a small portion of someone’s day. To add a bit of context, experts estimate that world class wrench time is 55%. In reality, the average wrench time for most organizations is between 25%-35%. For the purposes of this discussion, high or low wrench time means that wrench times are outside of this range.
Low wrench time means that technicians are spending too much time doing something besides performing maintenance. However, low wrench time does not necessarily mean that time is being wasted. As mentioned earlier, retrieving items from a stockroom or troubleshooting a breakdown is within the scope of a technician’s work but doesn’t involve physically repairing an asset. Other causes of low wrench time include:
- Technicians not performing up to their true potential
- Poor maintenance planning and scheduling
- Asset not being available for planned maintenance
- Unexpected emergency maintenance events
- Waiting for parts and tools
- Inaccurate time tracking
If a technician’s wrench time is consistently low, review the jobs that have the lowest scores and try to identify the underlying problems.
High wrench time is generally positive. However, wrench time that seems too good to be true can be cause for concern as well. Depending on how wrench hours are recorded, numbers can easily be inflated so as to make an employee appear more productive than they actually are.
Mean Time to Repair (MTTR)
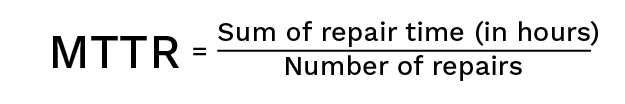
Mean Time to Repair (MTTR) is the average time it takes to repair an asset. Unlike wrench time, MTTR accounts for the total time a technician is actively working on solving the issue, including travel time to the asset, troubleshooting, performing the repair, and testing the solution. Though MTTR is typically used as an asset management KPI, it is impacted by the efficiency and effectiveness of labor resources.
To calculate MTTR, divide the sum of repair time (usually in hours) by the number of repairs in the reporting timeframe. Note that MTTR is calculated per asset or asset class.
How to Interpret Mean Time to Repair
Interpreting MTTR can be tricky because the number will rise and fall based on the types of repairs that were done during the time period. Therefore, it is best practice to calculate MTTR by the type of repair performed on an asset or asset class.
An MTTR value that trends higher over time means that assets are taking longer to repair. One possible cause for this trend is labor performance. Start by identifying who performs repairs on the asset and, using other maintenance productivity KPIs, determine if the cause is employee related. For example, a particular technician may not have the correct skills for making the repair.
It is important to look at low MTTR in context with other information about your assets and maintenance process. For example, aging assets are more difficult to repair than new ones. Unavailable parts cause long delays in maintenance work. Previously neglected preventive maintenance work leads to more critical, complex, and lengthy repairs.
MTTR values that trend lower over time mean that your maintenance process is optimized for speedy repairs. In terms of labor, low MTTR means that technicians are quick to respond to maintenance issues, well-trained, able to troubleshoot efficiently, and are not wasting time.
Track Employee Productivity and Maintenance Performance with FTMaintenance Select
FTMaintenance Select is a powerful CMMS platform that empowers your team to stay productive by providing them with access to critical asset and maintenance information. Maintenance reports provide insight into your day-to-day maintenance operations and allow you to keep technicians accountable for how their time is spent. Request a demo today to learn more.