
Preventive maintenance (PM) is a critical part of any maintenance strategy. No matter the industry, the ability to preempt failures and breakdowns can lead to a wide array of benefits. However, effective preventive maintenance requires ample time, money, and effort.
With so many resources dedicated to preventive maintenance, you – as well as other management – will want to know: Is your preventive maintenance program working? In this article, we explore a number of key metrics to help you measure your preventive maintenance effectiveness.
| This article is part of a maintenance management metrics KPIs series. Read our other KPI articles: |
Measuring Preventive Maintenance Effectiveness
In order to understand whether your preventive maintenance program is meeting or falling short of expectations, you must measure it. Measuring preventive maintenance effectiveness requires solid and consistent documentation. Organizations using paper-based or spreadsheet-based maintenance tracking systems may find it difficult to do proper analysis, due to unreliable or incomplete data. Generating reports or making calculations will be time-consuming. That’s why documenting maintenance activities is best done with computerized maintenance management system (CMMS) software.
Download Ebook: 10 Reasons to Use a CMMS over Maintenance Spreadsheets
Preventive maintenance software like a CMMS is an invaluable tool for measuring and improving preventive maintenance effectiveness. It provides tools you need to automatically schedule, manage, and track preventive maintenance activities. CMMS software stores preventive maintenance data so it can be used for robust analytics and reporting. Powerful maintenance reporting features, allow you to generate insightful PM reports that will help you improve the effectiveness of your preventive maintenance program.
Preventive Maintenance Metrics
There are a number of ways to measure preventive maintenance effectiveness and each organization may do so differently. Furthermore, what key performance indicators (KPIs) are used depends on your organization’s goals. The following sections provide an overview of common preventive maintenance metrics you can use to help you reach your maintenance management goals.
For your convenience, a quick reference sheet of the KPIs discussed in this article are available in our Common Preventive Maintenance KPIs infographic.
Planned Maintenance Percentage
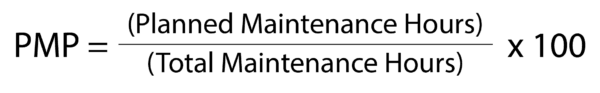
Planned Maintenance Percentage (PMP) measures how much time is spent on planned versus unplanned maintenance in a given timeframe. This simple metric allows you to quickly see how maintenance time is being spent.
Make special note of the word planned in this equation. While preventive maintenance will likely make up most, if not all, of your planned maintenance, other types of proactive maintenance, such as predictive maintenance, should also be included here.
To calculate Planned Maintenance Percentage, divide the total number of planned maintenance hours by the total number of maintenance hours (both planned and unplanned). Then multiply by 100 to get the percentage.
How to Interpret Planned Maintenance Percentage
PMP tells you how much of your maintenance activities are scheduled in advance, compared to how much time was spent reacting to asset breakdowns. Typically, a low PMP – meaning little time is spent on planned maintenance – shows that assets may be unreliable and more susceptible to unplanned downtime. It is assumed that assets with a high PMP will generally face fewer unexpected issues. Note that a low PMP is not necessarily bad, as we will explain shortly.
When measured for a specific asset, PMP indicates the proportion of work performed as part of a preventive maintenance plan. PMP can be looked at together with other asset management KPIs, such as Mean Time Between Failure (MTBF), to identify areas of improvement to the asset’s preventive maintenance plan. A centralized maintenance tracking system, like a CMMS, makes generating these reports quick and easy.
So, what is considered a “good” PMP value? While there is an often stated target of 80% of work being planned versus 20% reactive, the ideal PMP will differ by organization.
For example, planned maintenance activities for facility assets are generally more spread out (and therefore occur less often) compared to planned maintenance in manufacturing. Seasonal preventive maintenance, like furnace tune-ups, or assets designed to run-to-fail, like light bulbs, also influence PMP. Tracking PMP over time helps you understand where you are now and set improvement goals for the future.
Preventive Maintenance Compliance
Having a preventive maintenance plan is useless if it’s not followed. That’s where this next preventive maintenance effectiveness metric comes in. Preventive Maintenance Compliance (PMC) is a measure of how many scheduled preventive maintenance work orders are completed within a set amount of time. It can be an indicator of whether PM schedules are being adhered to and how well your PM program is working.
Preventive Maintenance Compliance is determined by dividing the number of completed PM work orders by the number of scheduled work orders within the timeframe, then multiplying by 100 to get a percentage. Note that scheduled and completed should only count those work orders that were originally scheduled to be completed in this timeframe.

How to Interpret Preventive Maintenance Compliance
Preventive Maintenance Compliance tracks whether preventive maintenance is being performed and can help keep your team accountable. Low PMC signals that PM work is planned but isn’t being completed and that further investigation is needed. There could be many reasons for low PMC, such as the following:
- Work orders are being lost or ignored due to an inefficient work order management process.
- Assets may not be available for maintenance when scheduled.
- Irrelevant tasks are purposely being skipped.
- Not enough maintenance resources are available to complete the work.
- Tasks are not being communicated to maintenance staff.
Related Reading: Creating a Culture of Accountability with a CMMS
One shortcoming of PMC is that it doesn’t tell you how many work orders were completed late or how far past their due date they were completed. To overcome this, it is important to look for how many PM work orders are completed by their due date. This is easily done in a CMMS.
Skipped PM Percentage
Somewhat related to Preventive Maintenance Compliance is a measure of how many PM work orders were not completed because they were skipped, aka skipped preventive maintenance percentage. Skipped work orders are different than those that are simply postponed or completed late – they are intentionally disregarded.
For example, a preventive maintenance work order might be skipped because tasks were completed during a recent corrective maintenance event. A frequently occurring PM might be skipped because the asset was unavailable at the time the work was to be performed. Depending on your available labor resources, you might choose to skip a PM because no one was available to do the work.
Skipped PM percentage can be calculated by dividing the number of skipped PMs by the number of scheduled PM work orders within the time frame, then multiplying by 100 to get a percentage.

How to Interpret Skipped PMs
A high Skipped PM value (meaning many PMs are skipped) indicates there are underlying issues that warrant investigation. First, it can be an indicator of the level of communication between the maintenance team and the party that requires maintenance. For instance, an asset may be inaccessible for maintenance due to a scheduling conflict with the production team or a tenant. A CMMS makes it easier to share and communicate the maintenance schedule with other departments or people.
Another reason the Skipped PM value could be high is that preventive maintenance is being done too often. Performing preventive maintenance on assets that don’t need it leads to unnecessary downtime, labor costs, and parts usage. It also increases the risk of reducing reliability caused by incorrect re-assembly or other errors. Preventive maintenance software makes it easy to change and fine-tune PM schedules.
A third reason that preventive maintenance might be skipped is a lack of adequate labor resources. Perhaps there are simply not enough technicians available to complete the work on time. Maintenance reports provided by a CMMS can help balance the workload, reprioritize tasks, and build a case for additional staff.
Scheduled Maintenance Critical Percentage
Scheduled Maintenance Critical Percentage (SMCP) measures the impact of late planned maintenance work. This metric quantifies the risk associated with overdue preventive maintenance work orders relative to their work order cycle, making it easier for you to prioritize which PM jobs to complete first. For example, a weekly PM work order that is 5 days late impacts an asset’s longevity and likelihood of failure more than an annual work order that is overdue by 5 days.
To calculate SMCP, you must know the PM work order’s recurrence and the number of days the procedure is late. Once you have that information, you can use the following formula:

How to Interpret Scheduled Maintenance Critical Percentage
Falling behind on preventive maintenance increases the risk of downtime, the severity of breakdowns, and the amount of backlogged maintenance work. When you are behind on preventive maintenance, it can be difficult to know which tasks to perform first. SMCP compares the criticality between jobs in order to make this decision easier.
Typically, the higher the SMCP, the longer overdue (and therefore more critical) it is to complete the task. To illustrate, let’s compare two tasks on a CNC lathe: greasing the chip conveyor and cleaning the coolant tank. The chain on the chip conveyor should be greased quarterly (every 90 days), but you’re 9 days behind. The coolant tank is to be cleaned semi-annually (every 180 days). This work order is also 9 days late. Let’s calculate the SMCP, using the formula presented above:
Conveyor: ((9 + 90) ÷90) x 100 = 110%
Coolant Tank: ((9+180) ÷ 180) x 100 = 105%
In this example, greasing the chip conveyor should be prioritized over cleaning the coolant tank. Notice how the work order’s recurrence impacts the severity of the job. The SMCP demonstrates that it is more critical to complete the overdue quarterly work order first before addressing the overdue semi-annual work order.
Be aware that, while SMCP is useful, it doesn’t account for the types or significance of failures that the PM work order is intended to prevent. Look back at our example: a poorly greased chain might slightly slow down the chip conveyor whereas poor coolant quality can affect tool and machine life. Therefore, it is important to “look beyond the numbers” with SMCP – or any preventive maintenance KPI, for that matter.
Aside from measuring criticality, SMCP can bring attention to reasons why work orders are late. For example, perhaps tasks are held up because there aren’t enough technicians scheduled to keep up with the workload. It’s also possible that you underestimated how long it takes to complete the work. You might even have to reprioritize tasks so that habitually late tasks can be completed on time.
Track Your Preventive Maintenance with FTMaintenance
Effective preventive maintenance is the hallmark of any maintenance strategy. The preventive maintenance metrics provided in this article help you make smarter management decisions regarding maintenance operations. Tracking preventive maintenance data is best done in a CMMS, like FTMaintenance.
FTMaintenance allows you to craft and execute a master preventive maintenance plan for all of your assets. Additionally, FTMaintenance tracks the data you need for generating crucial maintenance management reports. Schedule a demo of FTMaintenance today to learn more.
For tips on how to improve your preventive maintenance plan, check out our blog post 12 Tips for Improving Your Preventive Maintenance Plan.