Organizations that practice lean manufacturing seek to maximize output and work as efficiently as possible. However, manufacturing is a complex process that has many sources of waste, including equipment, machine operators, and production processes. In order to identify and reduce losses, organizations must be able to measure the efficiency of their manufacturing process. That’s where overall equipment effectiveness comes in. This article explores overall equipment effectiveness and its relation to maintenance.
What is Overall Equipment Effectiveness?
Overall equipment effectiveness (OEE) is a business metric that compares your equipment’s ideal performance to its actual performance. “Ideal performance” is considered to be a manufacturing process in which productivity is 100% – meaning that only good parts are produced, as fast as possible, without stopping. However, this level of perfection is impossible. In the real world, equipment fails, employees require breaks, and production processes are imperfect. Therefore, OEE measures how close your “actual” production process is to an ideal one.
What does OEE Mean for Maintenance?
As its name states, OEE is a measure of equipment effectiveness, not maintenance effectiveness. So, why then, should the maintenance team care about OEE? Maintenance activities influence an asset’s availability and reliability, which affect its OEE rating. Conversely, an asset’s OEE rating may change the way you schedule, manage, and carry out maintenance tasks.
Calculating overall equipment effectiveness may not be maintenance’s responsibility, but it is still valuable to learn how OEE is calculated and its significance. As you continue through this article, keep in mind that tracking and monitoring OEE is a company-wide effort, and that the activities of other non-maintenance departments factor into the OEE calculation.
Download our Common Asset Management KPIs Infographic for a quick reference to OEE.
How is OEE Calculated?
Before we jump into OEE calculations, we have a few words of caution. In order to calculate OEE, your organization should have the following in place:
- Well-defined standard operating procedures
- A positive relationship between all associated departments including the maintenance, reliability, and production departments, as well as management
- The ability to track and monitor asset and production data over time
- A computerized maintenance management system (CMMS)
- A well-run preventive maintenance program
OEE calculations require that you track and monitor certain data related to your manufacturing process and equipment. Each of these data points is outlined in its corresponding section below. If you are not currently tracking these values, you will need to collect this data before calculating your OEE. Once you have this information available, you may proceed.
OEE Formula

Overall equipment effectiveness is the product of three factors: availability, performance, and quality. Therefore, the OEE formula is availability multiplied by performance multiplied by quality. Each of these factors is explored below.
When performing the calculations listed, use the smallest unit of measurement you can and apply it consistently throughout. For example, if time is measured in seconds, every other time measurement should also be measured in seconds. Some time conversion may be required. Failing to use the same units of measure throughout will lead to inaccurate and useless results.
Availability
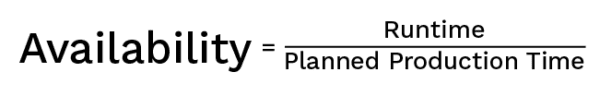
Availability is a measure of an asset’s actual runtime compared to its planned production time. To calculate availability, divide the runtime (i.e., uptime) by the planned production time (i.e., sum of uptime plus downtime).
In this formula, runtime is the amount of time when the asset is actually running and not experiencing downtime, also called uptime. Planned production time covers the entire time period the asset was expected to run, even if it did not. Therefore, planned production time is the sum of uptime plus downtime.
Asset availability takes into consideration any events that cause downtime and stop planned production for a significant amount of time. How “significant” downtime is defined depends on your organization, but it is commonly any stops that are several minutes long or long enough to warrant the tracking of the downtime event.
Downtime includes both planned and unplanned downtime. Planned downtime includes events such as setup, changeovers, adjustments, cleaning, and planned maintenance. Unplanned downtime is caused by equipment failures leading to unplanned maintenance.
Quick Reference: Data Required to Calculate Availability
|
Performance
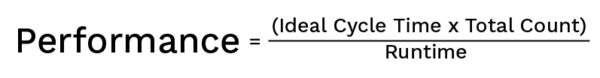
Performance is a measure of how long it takes to complete a process, such as producing a single unit of a product, compared to the ideal time. To calculate performance, multiply the ideal cycle time by the total count of product, then divide by the runtime. The ideal cycle time is the theoretical maximum speed at which a single unit can be produced.
The performance metric takes into consideration anything that causes production to run at less than maximum speed, such as small stops and reduced operating speed. Small stops are caused by events such as misfeeds, jams, or misaligned sensors, and typically do not require maintenance to intervene. Organizations that employ autonomous maintenance as part of a total productive maintenance (TPM) program are able to greatly reduce small stops. Slow cycles are caused by normal wear and tear, poor lubrication, dirt and debris, and other factors that account for a less-than-ideal cycle time.
Quick Reference: Data Required to Calculate Performance
|
Quality
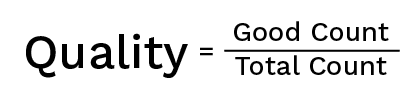
Quality is a measure of how many good units are produced compared to the total number of units produced. “Good” units are considered those that meet quality standards. It excludes scrap, defects, and units that require rework. Total count includes all units produced, regardless of quality.
Poor quality occurs when imperfect units are produced during startup or stable production. During startup, equipment may run through a warm-up cycle where non-usable units are produced. Additionally, human error can lead to incorrect equipment settings or problems during a changeover, which also affect quality. During stable production, incorrect settings and operator error can be responsible for scrap or rework.
Quick Reference: Data Required to Calculate Quality
|
Putting It All Together: Calculating OEE
Let’s calculate OEE for a fictional production asset using the following information:
- Planned production time was an 8 hour shift (28,800 seconds).
- An asset experienced 1 hour (3,600 seconds) of downtime.
- The fastest a good unit can be produced is 3 seconds.
- Out of 7,000 units produced, only 6,500 met quality standards.
Availability
To find the runtime, subtract the downtime from the planned production time. In 8 hours of planned production time (28,800 seconds), there was one hour (3,600 seconds) of downtime. Therefore, there were 7 hours (25,200 seconds) of runtime.
Availability = 25,200 seconds / (25,200 seconds + 3,600 seconds) = 0.875
Performance
Under ideal conditions, it takes 3 seconds to produce a single unit. 7,000 units are required. As established in the availability calculation, runtime is 7 hours (25,200 seconds).
Performance = (3 seconds/unit * 7,000 units) / 25,200 seconds = 0.833
Quality
Of the 7,000 units produced, 500 were considered defective.
Quality = 6,500 units / 7,000 units = 0.928
Overall Equipment Effectiveness
With values for availability, performance, and quality, you can now calculate OEE by multiplying the values together.
OEE = 0.875 * 0.833 * 0.928 = 0.676
Multiply the result by 100 to express OEE as a percentage. In this example, the OEE rating is 67.6%
How to Interpret OEE Rating
Your first OEE calculation provides a benchmark against which to compare future OEE ratings. Since the rating is broken down into three parts (i.e., availability, performance, and quality) you can focus on factors that are lagging. After changes have been in place for some time, calculate OEE again and compare the results. Try not to get too hung up on the number itself – what’s important is that the number improves over time.
World-Class OEE
When reading about overall equipment effectiveness, you will often see a cited world-class OEE rating of 85%. While it is tempting to compare your OEE to this number, keep a few things in mind.
First, it is very challenging to achieve a high OEE rating. Consider a production line whose availability, performance, and quality are all 90%. Sounds pretty good, right? Based on the formula used earlier, the OEE rating for this production line is 72.9% – well below the 85% world-class rating.
Second, the development of world-class OEE was based on experience working in plants that had successfully implemented total productive maintenance (TPM). Organizations that have not done so are unlikely to come close to 85% OEE. In reality, the OEE in most organizations is closer to the 45% – 60% range.
Last, OEE ratings are only true for the exact assets or production processes being measured. OEE ratings should not be compared asset-to-asset or process-to-process unless they are identical. You should not compare OEE between dissimilar assets, processes, organizations, or industries given their numerous differences.
How Maintenance Can Improve Overall Equipment Effectiveness
One of the most important ways the maintenance team can improve OEE is to use a computerized maintenance management system (CMMS). CMMS software tracks critical data about your assets and maintenance process, helping you better manage, organize, and document maintenance activities. Leveraging a CMMS enables you to easily make changes to maintenance operations that contribute to OEE improvements.
A CMMS can be used to collect data about asset failures, maintenance history, and unplanned downtime, useful for improving availability and performance. In terms of performance, organizations can use CMMS software to optimize preventive maintenance schedules, provide technicians with checklists for completing maintenance tasks, and track failure trends.
Proactive maintenance activities planned and managed through a CMMS keeps equipment in optimal condition, thereby impacting quality. In addition, CMMS software functions as a maintenance request system that allows machine operators or others to submit service requests directly to the maintenance department, increasing the awareness of maintenance needs.
Improve Equipment Maintenance with FTMaintenance Select
Though effectively utilizing overall equipment effectiveness is a company-wide effort, the maintenance team has a big role to play in improving asset availability and performance. FTMaintenance Select computerized maintenance management system (CMMS) software provides a single platform for documenting, managing, and tracking maintenance activities, and can be useful tool for OEE calculations. Schedule a demo today to learn more about FTMaintenance Select.