Maintenance management plays a crucial role in successful farming and agribusiness. While traditional farming practices have remained largely the same, the tools and technologies that support these activities have changed dramatically. And as farming operations grow more complex, maintenance becomes a constant concern, affecting everything from the condition of buildings and infrastructure to the performance of heavy machinery and equipment.
Given the critical role that maintenance plays in farm operations, many agricultural organizations are turning to computerized maintenance management system (CMMS) software to modernize their approach to maintenance management in an increasingly technology-driven industry. In this article, we discuss common agricultural maintenance challenges and how a CMMS helps ensure reliable operations and supports the future of farming.
The Role of Maintenance in Agriculture
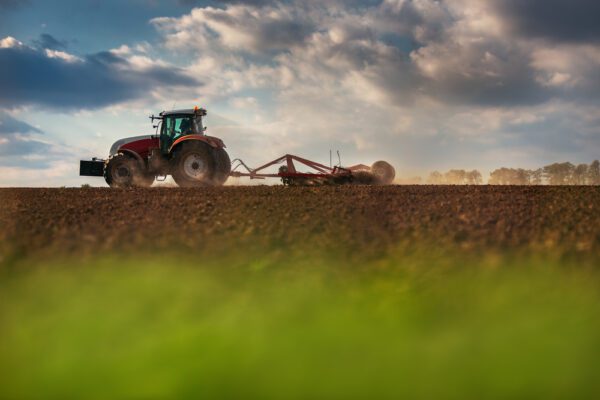
Agricultural equipment and assets are significant investments, often serving highly specialized functions. Because of these high costs, most farmers can’t afford backup assets, and instead must work tirelessly to keep their equipment, facilities, and infrastructure in peak operating condition.
Complicating matters is that, unlike typical manufacturers, farmers operate under the influence of uncontrollable natural forces such as extreme weather, changing seasons, and the long-term effects of climate change. As a result, they must work within strict timeframes and address maintenance issues immediately; any delays in planting, harvesting, or caring for livestock can jeopardize the season’s yield and profits.
Beyond productivity, agricultural maintenance is essential for safety – both for farmworkers and the environment. Farm assets must be adequately maintained to protect soil, water, and stored food from contamination, and workers from various mechanical, electrical, chemical, and other hazards.
Due to all of these factors, farms and other agribusinesses rely heavily on proactive maintenance practices and quick repairs in order to remain on schedule and ready at a moment’s notice. Because equipment downtime has a more immediate and direct impact on productivity, maintenance is a top priority at all times.
Read: How to Implement a Proactive Maintenance Strategy
Challenges of Agricultural Maintenance
Farmers must navigate a variety of agricultural maintenance challenges to ensure their farm equipment and facilities run smoothly and efficiently.
Rising Equipment Costs and Complexity
To keep up with the economic and operational demands of modern agribusiness, farm equipment has become more technologically advanced than ever before. While these innovations improve efficiency and make equipment compliant with environmental regulations, they also require more specialized knowledge to use and maintain.
Instead of simply replacing mechanical parts, modern farming machines rely on sensors, software, and complex electronics that require higher-skilled labor for repairs. At the same time, the rising cost of farm equipment puts pressure on budgets, sometimes leading to deferred maintenance or makeshift repairs that can reduce reliability and increase long-term maintenance costs.
Workforce and Skills Gaps in Farm Maintenance
Large agribusinesses may employ dedicated maintenance staff, but many farms rely on family members or seasonal laborers – often with little formal training – to carry out maintenance tasks. While practical, hands-on knowledge is valuable, many workers lack the technical expertise to troubleshoot or properly repair today’s increasingly complex machinery.
Farm maintenance goes beyond just fixing equipment; it also involves maintaining buildings, irrigation systems, storage facilities, and more. With such a wide range of task in a wide range of environments, it’s difficult for any one person to be skilled in every aspect of farm maintenance. Compounding this challenge, farmworkers are often out working on their own without immediate access to maintenance information or guidance from experienced personnel. This leads to makeshift repairs, improper tool usage, and increased health and safety risks.
Additionally, the pressure to cut costs may force farms to delay maintenance and avoid professional repair services, further increasing the risk of equipment failures and downtime.
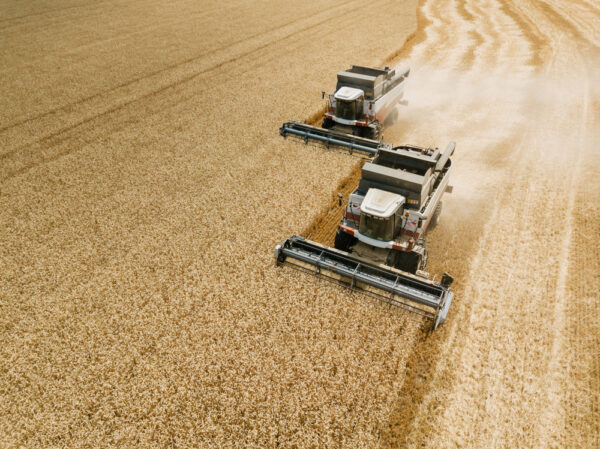
Maintenance Challenges in a Time-Sensitive Industry
Farms operate on a strict schedule with little time for delays. While downtime is costly in traditional manufacturing environments, it has immediate and often irreversible effects in agribusiness. Missed planting windows, delayed harvests, or equipment failures during critical times can mean significant financial losses.
In an effort to stay on schedule, maintenance is often postponed in favor of keeping up with daily farm operations, leading to rushed, short-term fixes that may cause greater damage and cost more in the long run. Additionally, due to time constraints, farmers have little time to formally train staff on proper maintenance procedures. Instead, they rely on passing down practical knowledge through experience, which can reinforce poor maintenance and safety practices.
Environmental and Location-Based Obstacles
Farms operate in open, uncontrolled environments that pose unique maintenance challenges. Equipment and infrastructure are exposed to harsh and extreme weather conditions, which accelerate wear and tear.
Due to the operational demands of farm equipment during peak seasons, major repairs are often saved until the offseason. However, this creates an overwhelming backlog of maintenance tasks, making it difficult to complete all necessary repairs before the following season. Being located in rural areas may also limit access to parts and service providers, further delaying critical maintenance work.
Farmers must also consider the environmental impact of farm machinery maintenance. Oil leaks, chemical spills, and poorly maintained storage facilities can lead to soil, water, and food contamination. This puts crops, animals, and workers at risk, as well as exposes farms to liability from regulatory agencies.
Reliance on Traditional Maintenance Methods
With limited time and resources, may farms fall back to manual maintenance tracking methods such as paper logs or spreadsheets. While this may work on a small scale, it becomes unsustainable as operations grow. Without a structured maintenance system in place, it is difficult for farmers to be proactive about agricultural maintenance.
Threats to Health and Safety
Aside from regular operations, health and safety are a major concern for farmers. Agricultural maintenance involves working closely with powerful machinery that has fast-moving belts, blades, augers, and other mechanisms. According to the United States Department of Agriculture (USDA), machinery maintenance is a leading cause of farm-related injuries. Agricultural workers also face higher rates of illness, respiratory diseases, musculoskeletal disorders (MSDs), and other health issues compared to workers in other industries. Without proper maintenance, these risks increase.
How CMMS Modernizes Agribusiness Maintenance
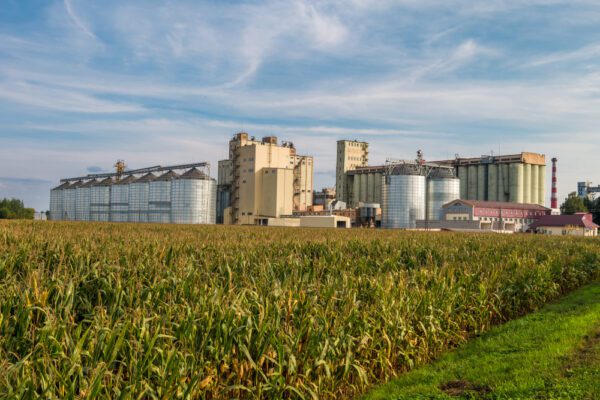
Computerized maintenance management system (CMMS) software is widely used across different sectors of the agricultural industry. Whether managing crop production, livestock, or agricultural manufacturing, a CMMS helps streamline maintenance processes. The following sectors can greatly benefit from a CMMS:
Each of these sectors depends on well-maintained equipment and infrastructure to operate efficiently. Below are some of the ways a CMMS helps modernize and improve maintenance operations in the agriculture industry.
Improved Asset Management
A CMMS provides a centralized system for tracking all heavy equipment, facilities, and consumable inventory assets. Farmers can monitor their assets’ locations, conditions, and service histories to ensure timely maintenance and reduce the risk of failure. Additionally, integrated spare parts management features prevent unnecessary downtime by providing real-time inventory updates that ensure parts are available when and where they are needed.
Improved Equipment Reliability
Preventive maintenance is essential to keeping critical machines running during peak operational periods. A CMMS ensures that preventive maintenance is appropriately scheduled and completed, reducing the risk of equipment failures. Automated work order generation ensures that no tasks fall through the cracks, while automatic notifications alert farmworkers to upcoming jobs, helping them stay on top of maintenance even during busy times of the year.
Centralized Maintenance Knowledgebase
A CMMS serves as a valuable source of knowledge about your farm equipment maintenance that can be shared with future generations and seasonal laborers. By storing maintenance data in a single, centralized system – instead of keeping it all in one’s head – everyone on the farm can work from shared knowledge about your assets, inventory, and maintenance history.
Additionally, a CMMS helps you build a digital maintenance library, giving you and your team anytime access to maintenance and safety documentation, including troubleshooting guides and repair documentation. These reference materials help everyone accurately and safely complete maintenance tasks and reinforce proper maintenance practices.
Data-Driven Decision-Making
Given their busy schedules, farmers want to ensure that they focus their effort on tasks that will have the greatest impact. Using CMMS software, you can leverage historical work order records and reports to analyze asset performance and make tweaks to the timing or scope of maintenance tasks.
By identifying trends or patterns in farm equipment failures, you can optimize maintenance schedules, reduce unnecessary maintenance tasks, and focus on performing the tasks that will increase reliability and maximize equipment life. A more targeted approach not only improves equipment performance, but leads to long-term savings through reduced labor costs, minimized wasted resources, and prevention of costly emergency repairs.
Recommended Reading: 3 Important Asset Management KPIs and How to Use Them
Mobile Access to Maintenance Data
Often times, farmworkers work in remote areas far away from direct supervision, making it difficult to request assistance when needed. A mobile CMMS solution allows workers in the field to access equipment service history, log maintenance activities, submit service requests, and follow troubleshooting or maintenance procedures from mobile devices. This connectivity improves the consistency and efficiency of maintenance tasks.
On-premise Installation for Rural Locations
Many farms are located in areas with unreliable internet access, making cloud-based solutions impractical. A locally-installed CMMS solution allows farmers to reap the benefits of a CMMS without relying on an internet connection. Some vendors, such as FTMaintenance Select, also support mobile accessibility within your local network or through a CMMS mobile app with offline access, allowing workers to input data and sync updates once a connection is available.
Documentation for Maintenance Audits
Farms and agribusinesses must comply with strict and evolving regulations covering equipment safety, environmental protection, workplace safety, and more. CMMS software helps ensure compliance by allowing you to store and share critical health and safety documentation, such as lockout-tagout (LOTO) procedures and MSDS documents, with your team. When audit time comes, you can quickly access historical work orders, audit trail logs, and maintenance reports that provide clear evidence of compliance.
Further Reading: Why You Shouldn’t Fear Maintenance Audits
Modernize Agricultural Maintenance with FTMaintenance Select
Modern agricultural maintenance requires farmers to integrate new technologies into traditional farm operations. At the center of farm life is a well-maintained fleet of equipment, facilities, and infrastructure that keeps daily operations moving. FTMaintenance Select is an easy-to-use CMMS solution that helps farmers stay on top of maintenance tasks, reduce costly downtime, and extend asset life. Request a demo of FTMaintenance Select today to see how you can ensure your farm remains productive for seasons to come.
Recent Comments